On-Demand Transit Market Report — Midyear 2024
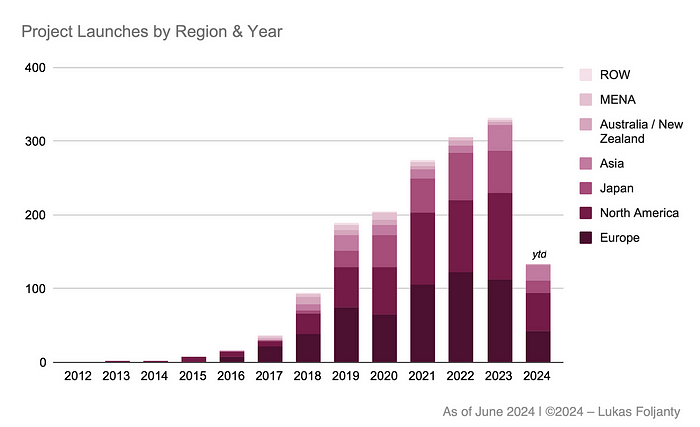
2023 was a super strong year for the On-Demand transit market with more than 330 service launches across the globe. Naturally, expectations run high for 2024. So where do we stand after the first 6 months of the year? Let’s take a look!
On-Demand Transit World Map (all projects)

On-Demand Transit World Map (active projects only)
Solid, but slower growth
As of writing this report, almost 1,600 On-Demand bus services have been launched globally, of which close to 1,000 are currently active. The first two quarters of 2024 contributed to this impressive market size by adding 120 new services (53 launches in Q1, 67 in Q2). In comparison to previous years, this number is smaller than in 2023 (+159) and 2022 (+135) and on the same level as 2021. These are not bad numbers, mind you, but it will be interesting to observe whether this is a start of a downward trend, or if 2024 can rebound in the second half of the year. After all, the market has so far only known one trajectory: Upwards!

When examining the market size it’s important to not just look at new service launches, but at the net market growth. Researching data on projects ending is harder for me than finding new service launches. Why? Simply because it’s much more common to put out a press release about something positive (“New service launch, yay!”) than something negative (“Sorry, no more convenient On-Demand bus service for you ¯\_(ツ)_/¯”). Therefore, I suspect that my dataset contains a number of ghost services which have actually long ended. But since this is going to be the case for all years, the comparative picture should be accurate enough. And here we see that the net growth in the first half of 2024 has been noticeably slower than in previous years.
- Q1+Q2 2024: +58 services
- Q1+Q2 2023: +100 services
- Q1+Q2 2022: +87 services
- Q1+Q2 2021: +73 services
Again, it’s too early to tell if this is the beginning of a trend or simply two weaker quarters with the market returning to previous growth rates subsequently. But considering that 3rd-party funding, which helped finance a large number of pilot projects, is running out in many places, it might be a sign that a relevant number of pilot services are not renewed.
Market segmentation-wise, there’s no change to previous quarters (or years, really): The public sector remains the main driver for growth with over 85% of new services in Q1 and Q2 2024 being public transit On-Demand projects. The B2B segment is steady at 15 to 20% and the B2C segment is barely worth mentioning. The last attempt in this space was short-lived i&any in Zurich in 2023. A new B2C service has been announced by Italian start-up Wayla, which plans to launch its new service targeted at youngsters and students in Milan in Autumn this year on ioki tech.

Geographically, the overall picture remains largely unchanged with Europe and North America continuing to be the biggest regions with the largest number of new service launches (38 in Europe, 50 in North America). However, the strongest relative growth is in Asia, which is fuelled by South Korea’s new appetite for On-Demand public transit, which Studio Galilei (VaroDRT) and Hyundai Motor Company (Shucle, 42dot) are satisfying in partnership with local PTOs.
And speaking of Asia: China seems to be coming back after the market — to my (undoubtably limited) knowledge — collapsed in the wake of the crack-down on big Chinese tech companies like DiDi in 2021, which powered a large number of services with its tech. I found mentions of new On-Demand bus pilots in press articles for a notable number of cities in China, but — alas — my non-existing Chinese makes researching the details quite tricky…
As for the front-running markets Europe and North America, North America was once again ahead in Q1+Q2 2024. The reason for pointing this out is that North America overtook Europe in 2023 for the first time in the number of new service launches. Now, this doesn’t make a proper trend yet, but it might be a reflection of 3rd party funding running out or being scaled back in Europe while the Biden-Harris administration continues to pump impressive sums into the public transit system in the USA.
Still hanging in there — The technology provider market
The technology provider market continues to be a very busy space and its characteristics are largely unchanged. Via is approaching the 400 services mark and four runner-ups can brag about having launched over 100 services during their existence. In total, around 50 technology providers are represented in my dataset.

When examining the average number of service launches per quarter it becomes clear that Via is widening the gap to the rest of the field with every quarter. As of Q2 2024, Via has been launching an impressive 17 services in average per quarter since 2021. A group of four is trying (in vain) to keep up with 5 to 6 service launches in average. It’s interesting to note that Hyundai is represented in this chart for the first time and I expect VaroDRT to displace another provider soon, too, if they can keep up their high growth rates of recent quarters.

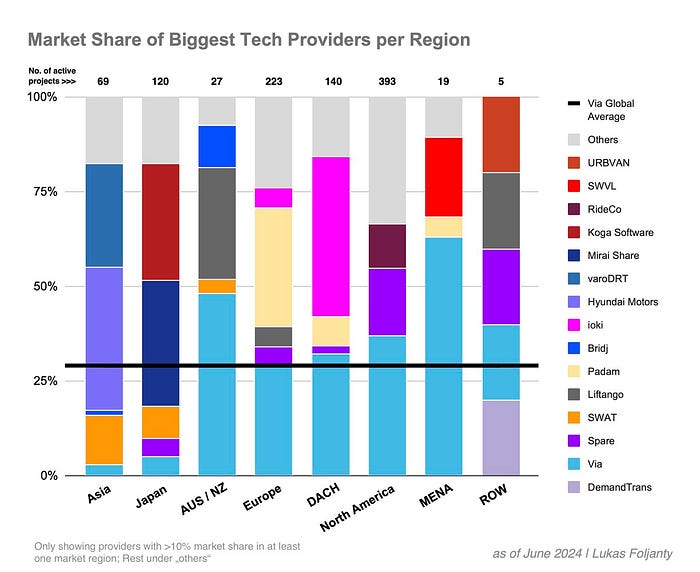
Geographically, the market penetration of the biggest players remains very similar to previous editions of this report. Via claims a global market share of 29%, but with significant differences on regional level, ranging from barely noticeable to over 50%. In Asia the regional market leaders come from South Korea, and Japan is dominated by Japanese companies Mirai Share and Koga Software (and Junpuzi which is sadly not represented in this report due to the lack of available information).
With regards to changes to the supplier landscape, relevant news comes from the German-speaking markets: Former Austrian market-leader ISTmobil GmbH skidded into insolvency and had to close shop in May, which is quite a sad development in my mind, considering that they managed to lead the market for many years without any major external funding. But I guess being squeezed between Austrian National Railways’ ÖBB Postbus Shuttle and an increasing push into the Austrian market from other On-Demand service providers like Via or ioki ultimately left them not enough breathing room to survive. The other news comes from Germany where the former CleverShuttle founders are attempting a resurrection in the shape of CleverSolutions. They are staying true to their Operations-as-a-Service business model from the CleverShuttle days and have just launched their first service in the county of Schweinfurt in Germany.
Meanwhile, Kuwait’s City Group, which is operating the Citylink Shuttle (Kuwait) on the door2door IP which it acquired when SWVL sent the Berlin-based On-Demand pioneer into insolvency in 2023, is expanding into Saudi Arabia and Dubai. Personally, I find Dubai a particularly interesting choice considering that the Bus On Demand service was just expanded as the outcome of a RFP last year, which UnitedTrans/Via won and were thus able to renew and expand the service that they had been running since 2020. But regardless of how the Dubai expansion performs for City Group, I find it quite intriguing that a regional solution provider is now emerging with a very convincing package of a proven technology, operational excellence and regional cultural fitness. And considering that the MENA region has become alive recently and is by my observation currently the only region in which larger fleets are deployed in public On-Demand bus services, City Group might be at the right place at the right time.
In semi-related news, Uber — which is in the process of sunning-down their B2G On-Demand solution — has (re-)introduced Uber Bus, a B2C pre-booked shared bus ride for a predetermined fare. In its new incarnation it’s called Uber Shuttle and focuses on events and airports in the US and on commuters in India.
On the funding front, Spare received $10M growth capital from the Canadian Imperial Bank of Commerce and SWAT Mobility closed a funding round of $7.2M mostly from Japanese corporate investors, which it plans (at least partly) to invest into expanding its business into routing optimisation for the logistics sector. Also in Japan, NearMe, Inc. raised ¥490M (~$3.2M) in series C. And as for the biggest of them all: We are still waiting for Via’s IPO. My guess is that we’ll have to have a little bit longer until the Fed lowers the interest rates, which many expect to happen later this year.
Productivity is key — or is it?
I examined the productivity of a of number of On-Demand bus services in my last report for the first time. The overall picture didn’t look great. After publishing the report, I received feedback by a few people that this benchmark made the industry look bad. That was not my intention. What was my intention was to hold the mirror to the industry to trigger a debate about the true value proposition of On-Demand transit and which use-cases it is good at serving. Which is why I’m doubling-down now with a much larger dataset and an adjusted calculation.
As I rely on publicly available sources (see Asterisk* a little bit below) and comparability is essential, I am using this formula to calculate the passenger per vehicle revenue hour as KPI for the service’s productivity:
Average number of passengers per week ÷ service hours per week × number of vehicles = passengers per vehicle revenue hour (PAX/VRH)This formula only needs three datapoints which can relatively easily be found on the internet. I have now introduced a correcting factor for the average fleet deployment rate. The reason behind this is that the full fleet of vehicles of a service is hardly ever deployed simultaneously, but only a certain percentage. I decided to use 75% as I feel that this accounts adequately for off-peak deployment rates, reserve vehicles, vehicle repair etc. I acknowledge that this varies between services, which can have very dramatic peak/off-peak differences. But in order to offer high service levels in form of short waiting times and minimal detour times you actually can’t reduce off-peak fleet deployment rates too severely. Which is why I decided to use the correcting factor of 75%.
So the final formula I am using is this:
Average number of passengers per week ÷ service hours per week × (number of vehicles × 0.75) = passengers per vehicle revenue hour (PAX/VRH)In response to my last report, a few tech providers and PTAs reached out and shared the PAX/VRH results of some of their services with me. I genuinely appreciate this. But I have no transparency over how the values were calculated. Therefore, for fairness and comparability’s sake, I have decided to only use the data directly provided to me when my calculated value is off by more than 50% in comparison. This is where aforementioned Asterisk* comes into play, which also indicates that I cannot verify these values.
My goal here is not absolute precision, but a comparative benchmark of the services’ utilisation rates. And I feel confident that with described methodology the calculated values are reasonably close to reality.

After examining 97 services from 22 different countries, this is what I found:
- The average PAX/VRH is 2.33.
- 13 services in my sample achieved over 4 PAX/VRH, which is a very good result for On-Demand transportation. The services are in as diverse places as car-centric Dubai, urban Jersey City, rural Lower Saxony in Germany, or super-dense Andorra. The technologies powering these services come from a range of different providers which is a clear sign of the advancing commodification of the technology to me.
- 18 services have results between 3 and 4 PAX/VRH, which I would still consider a solid result and another 24 services scored between 2 and 3 PAX/VRH, which one might consider borderline acceptable.
- More problematically however, 42 services achieved below 2 PAX/VRH which is not a great result considering the very high costs of operation that come with the fixed supply which — to my knowledge — all of these services have. And of those 42 services, 18 have less than 1 PAX/VRH, which in my mind is a clear sign that these services urgently need fixing. And while I wholeheartedly support providing the elderly with a means to participate in social life, or a single parent to go to work with affordable transportation, if the service’s productivity is so low, then ad hoc On-Demand transportation is just not the way to do it.
What’s the take-away from this? I’ll let you debate this in the comments section. But in my mind, this benchmark indicates quite clearly that there’s a definable window in which On-Demand mobility can demonstrate its true value. There’s a glass-roof which won’t rationally allow On-Demand services to go beyond a certain utilisation rate without running into the dilemma of service quality VS. operating costs. Because the more demand is attracted, the larger the fleet needs to grow in order to maintain service levels. And as long as driver costs are the main cost driver, seriously scaling the fleet will be financially prohibitive for most PTAs. Yes, autonomous driving could cut this Gordian knot, and a few new pilots have recently been launched (e.g. here, here or here). But before AVs are technologically and commercially viable, high performing On-Demand services will unavoidably be transformed (back?) into fixed-route scheduled services at some point.
And on the bottom end, the promise of ad hoc booking with super short waiting times will need to be sacrificed for the sake of economic viability. These services in the low demand spectrum are probably better served with mandatory pre-booking and fixed stops — something that one might argue is the quintessential definition of legacy DRT services. Some technology providers like Nemi have specialised on this use-case and are achieving impressive 8+ PAX/VRH in some of their services. But in my opinion, the optimisation problem that needs to be solved here is very different to real-time on-demand ride-matching and routing and thus, I have decided not to include this type of semi-fixed demand-responsive transport services in my benchmark.
And as a final thought on the matter of productivity: On-Demand services will only ever perform to their maximum when they don’t have to compete with fixed-route buses that have been running for decades or when they are confined to niches of the public transit network. On-Demand services must be part of the long-term network planning strategy and once implemented need to operate in areas where fixed-route buses are concentrated on main corridors only. Otherwise, what can you realistically expect?
Software-as-a-Struggle
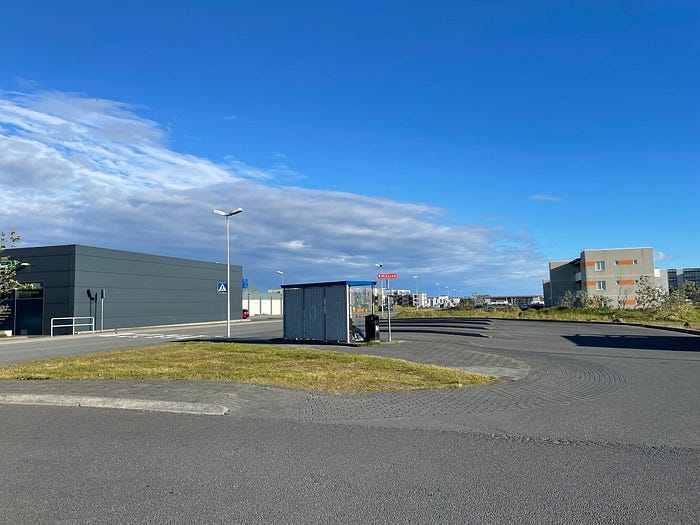
The Routing Company (TRC) recently launched an On-Demand employee transport service in Iceland. I applaud TRC and their partners for introducing an innovative and hopefully efficient new mode of transport in Iceland! The main reason why I’m highlighting this launch is different, though. It’s how long it took to hit the road: 2 years! I know this is because I was deeply involved in this project while still working at TRC. And I want to emphatically stress that TRC is not to blame for this very long timeline between first contact and service launch. But it is quite symptomatic for many public sector projects in the On-Demand transit space. And that’s a big problem.
It’s only natural that large projects require sufficient time for planning, procurement and roll-out. And this can easily span other the course of 2 years in which solution providers need to court the agencies, travel to their offices, conduct workshops, run simulations, advise on project setup and management etc. as part of their business development exercise (cost of sales).
For larger opportunities, this can pay off by helping the provider to have the edge in the following tender procedure. Unfortunately, this applies to most small projects, too. As a matter of fact, projects by smaller public transit agencies can take even longer to get signed and launched due to less or no dedicated staff to handle the project. If you then factor in that the majority of projects are (very) small, this can very quickly become disproportionate to the revenue potential of these deals.
From my observations the Software-as-a-Service business model that (almost) all technology providers are applying does not really work in the On-Demand transit space. The consultative selling approach that many providers follow to build the market (i.e. convince agencies that they need On-Demand and then how to go about it) can easily consume a large chunk of the revenue from the usually applied per-vehicle-per-month SaaS fee model.
Unfortunately, it doesn’t necessarily get much better once a deal is closed. Scalability on the technology side is often limited to the core technologies as the increasingly prevalent integration of On-Demand services into the wider fixed-route scheduled public transit network unavoidably requires localisation that is per se not scalable. Sometimes it can be as simple as the adopting the branding of the local PTA. But very often it requires technical integrations with data platforms or fare catalogues or bending the real-time (!) routing and ride-matching algorithms to serve use-cases that they were originally not designed for. The recent push into the Paratransit / commingling segment feels like such an endeavour. But I guess the much larger paratransit fleet sizes are tempting enough to justify taking this path (in my previous article I discussed my curiosity how specialised legacy paratransit tech providers are going to respond to this).

To top it off, customer success management is a chapter on its own. There are undoubtably public transit agencies out there that have the skills, resources, organisation and drive to assume a very proactive role to allow a project to advance quickly and not overburden the solution provider with tasks that they were not contracted for. Unfortunately, too often that’s not the case. Which means that despite being a technology supplier, many find themselves in a position in which they need to manage (notoriously) complex stakeholder landscapes that need to be aligned, do customer support, support marketing campaigns to increase ridership, and much more. And all of this for cutthroat monthly SaaS fees.
Personally, I believe that the scalable SaaS narrative — while understandable in the early market phases — proved to be a self-deception. It created aspirations on the PTA side which are now coming to haunt the industry. What used to be a project-specific pricing in which legacy DRT software suppliers factored in customisation, localisation, project management, operations etc. suddenly became these miraculous “all-in” fees based on the fleet size. But a per-vehicle-pricing can be tricky as its simplicity and transparency very quickly triggers a subjective maximum willingness to pay — which is shockingly low in many cases and usually includes a pretty aggressive degression for larger fleets. And the brutal competition of the past years during which the tech providers low-balled each other didn’t help either.
I believe PTAs are well-advised to not be tempted by low prices alone. Because what good does it do when your supplier has a strong incentive to minimise the effort it puts into your project? Everyone will tell you that they have industry-leading customer success management. But can you really expect special treatment when your project is not contributing to the profitability of the provider? Or worse still, are cheap SaaS fees really going to be worth the headaches, follow-up costs and negative press when your supplier collapses half-way through the project? I’d say no.
I also believe PTAs should carefully consider the software requirements they put into tenders. While I can fully understand the desire to integrate On-Demand services deeply into the wider public transit network, I don’t think this should happen on the back of the On-Demand technology providers. If the goal is to offer transit customers seamless journeys with reliable interchanges between On-Demand and fixed-route services and with integrated fares and ticketing, then the PTA must provide an infrastructure into which the On-Demand transit tech can plug in. From my point of view it doesn’t make sense to ask On-Demand tech provider to replicate these features on their systems. If you want to offer intermodal trips, your journey planner should have that capability. If you want to ensure that On-Demand and fixed-routes don’t compete with each other, your journey planner should include a logic to prevent that (which you control, btw). And you want your mobile ticketing solution to be available on your On-Demand service… I think you know where this is headed. There are multiple good reasons why this is the better way to do it for PTAs:
- Don’t distract the On-Demand tech provider with product development that is only loosely connected to its core technology. Allow it to focus on what it’s strong at and by doing so benefit from faster product improvements where it matters: on-demand routing and ride-matching in real-time.
- Create a coherent user experience across the entire public transit network and even between different types of demand-responsive transport services, even if they are running on different technology platforms.
- Assume control of how On-Demand and fixed-routes interact, balance your network and steer demand.
- Ensure continuity when the On-Demand tech provider changes.
- Accelerate tender procedures by having lean product requirements that focus on true differentiators (e.g. performance of algorithms) instead of a laundry list of superficial product features. Ultimately, this will help identify the best supplier for your specific service design.
- Allow On-Demand tech companies to realise realistic margins which will ensure on-going investment into products and innovation.
Prerequisite for this is obviously the existence of a journey planner that has the capabilities to integrate technologies of different On-Demand technology providers and harmonise the data. Which would be so much easier if the industry had established universal standards for this. GTFS-Flex is starting to see more adoption, but there’s still quite a long way to go before aforementioned “plug & play” will actually work. But I believe that it’s in the industry’s best interest to accelerate the establishment of standards. Just imagine: One day you won’t have to develop, operate and maintain today’s jungle of white-label stand-alone apps for at least two operating systems. Oh, joyous day!
Conclusions
At midyear point, 2024 is sending mixed messages. The number of new service launches is still considerable, but the net market growth has slumped. In my mind, this is a sign for the market entering a new maturity phase.

I created this chart a while ago (Q3/2022), but I believe it’s still largely correct (some national markets may have moved along on the X-axis a bit). We have arrived at the beginning of the steady state market phase in some key markets, which coincides with 3rd party funding for pilots running out or being scaled back significantly. PTAs are now at the crossroads whether to continue or stop their On-Demand transit services. Some will double-down. Others won’t. The transition from piloting phase to steady state market is not abrupt. We are still seeing new pilot projects launching, even in high-maturity markets like the USA or Germany. But the absolute market size is going to be smaller than in the heydays, and I believe the noticeably slower net growth of the market in the first half of 2024 is an indicator for this. When looking at the three paths I outlined in the chart, I believe most markets will land somewhere between Path 2 and 3. Some markets like the USA can potentially compensate some of the public transit-type projects with paratransit services. And the replacement of legacy technology in otherwise unchanged traditional DRT services can also help maintain a certain level of projects that need to be tendered anew periodically. And of course, some markets are just getting started, like South-Korea. But can higher growth rates in new regional markets or markets in earlier maturity phases counterbalance the slowing growth in the largest markets?
I’m curious to see where we stand at the end of 2024. Was Q1/Q2 the beginning of a trend or is the second half-year going to (over)compensate the slower start and put 2024 back on the trajectory trend of previous years? What do you think?
About this article
Hi, my name is Lukas and I have been writing this series of reports on the state and outlook of the On-Demand Transit market since 2020. I would like to provide some background and context so that you know how to read this article:
- Between 2017 and 2024, I was working at a range of On-Demand Ridepooling solution providers (check out my LinkedIn profile if you are interested which ones). I started this series of articles in response to the lack of data on this new market. It has always been a private project and was never part of my work at any of the On-Demand tech providers.
- The market is not so new anymore, but it prides me that my dataset, which is the basis for my reports, is still the most comprehensive source. This is to no small parts thanks to the On-Demand Transit community which has been extremely supportive by providing data and feedback.
- Nevertheless, all findings shared in the article should always be understood as informed indications, not hard facts. I invest many (many) hours before writing each edition of this report for updating my extensive dataset and try to be as diligent as I can. But there will be gaps and errors. If you notice either, please drop me a note!
- I try my very best to keep this report vendor-neutral. That will not stop me from expressing opinions about the state of the market or market participants (sometimes possibly provocative). However, should you ever have the impression that I am not being fair in how I present my findings, I appreciate if you send me a message and let me know.
- Possible deviations of facts and figures to previous articles of mine are most likely caused by retroactive additions to the dataset, which have been made possible in part by feedback and support from the On-Demand Ridepooling community. I appreciate the overwhelmingly positive and open response to my articles!
- The Google world map gets updated in the background, so it might show services which are not yet reflected in the analysis of this article.
- I use following terms synonymously: On-Demand Ridepooling, On-Demand Transit, On-Demand Transport, Microtransit, DDRT.
- The views expressed in this article are my own. They do not purport to reflect the opinions or views of my current employer.
- This article was first published on my LinkedIn profile in August 2024.